Weekly Metrics Report
A metrics report is generated each week for both your execs' and your calendars. This lets you quickly scan your week to understand:
- A breakdown of how your time is spent in meetings
- Which types of activities consume most of your time
- Patterns in your productivity
Each weekly report gives you a clear view of your calendar, breaking down your time by:
- Meeting types
- Internal vs. external interactions
- Other categories
Accessing your metrics
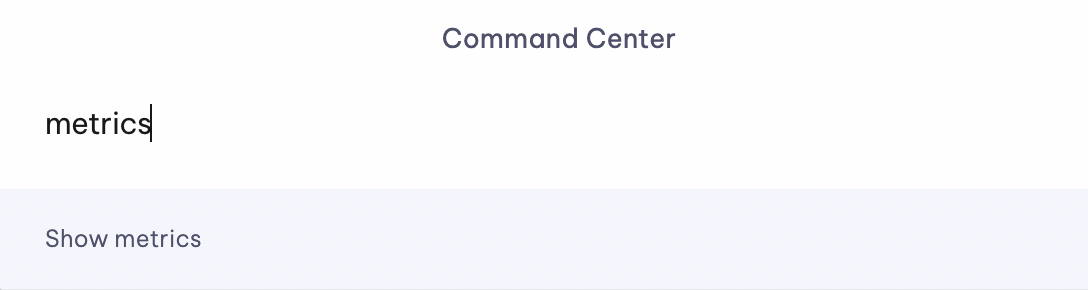
Search "Metrics" in the Command Center to view the report at any time.
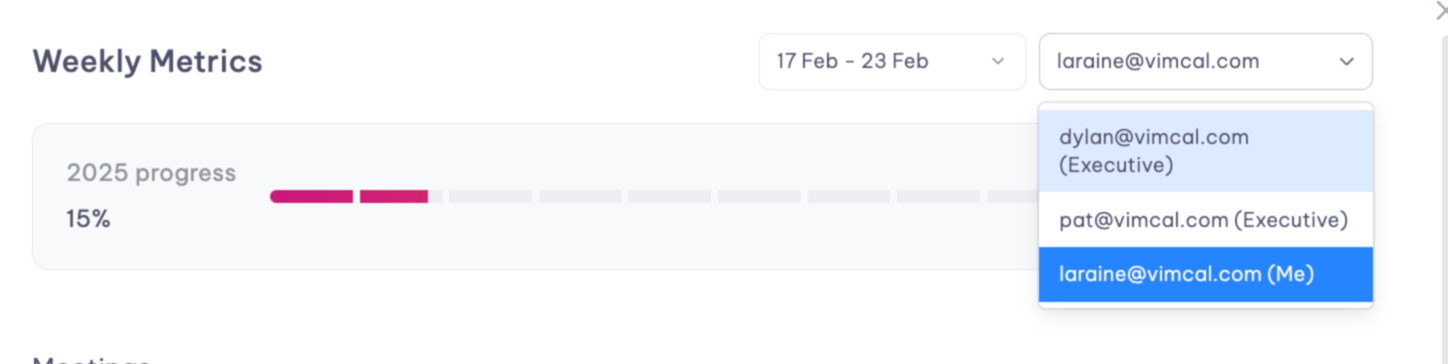
Your time at a glance
Your Weekly Metrics report shows how each of your executives are spending their days in meetings.
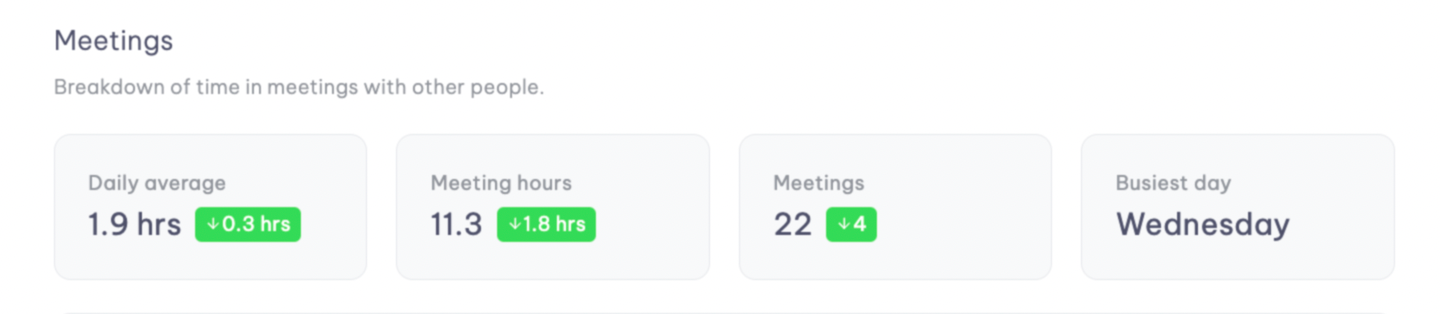
Meeting breakdown
Get a comprehensive breakdown of your meetings:
- Daily Average — Your typical meeting time per day
- Meeting Hours per Week — Total hours spent in meetings
- Total Meetings — Number of meetings this week
- Busiest Day — The day with the most meeting activity
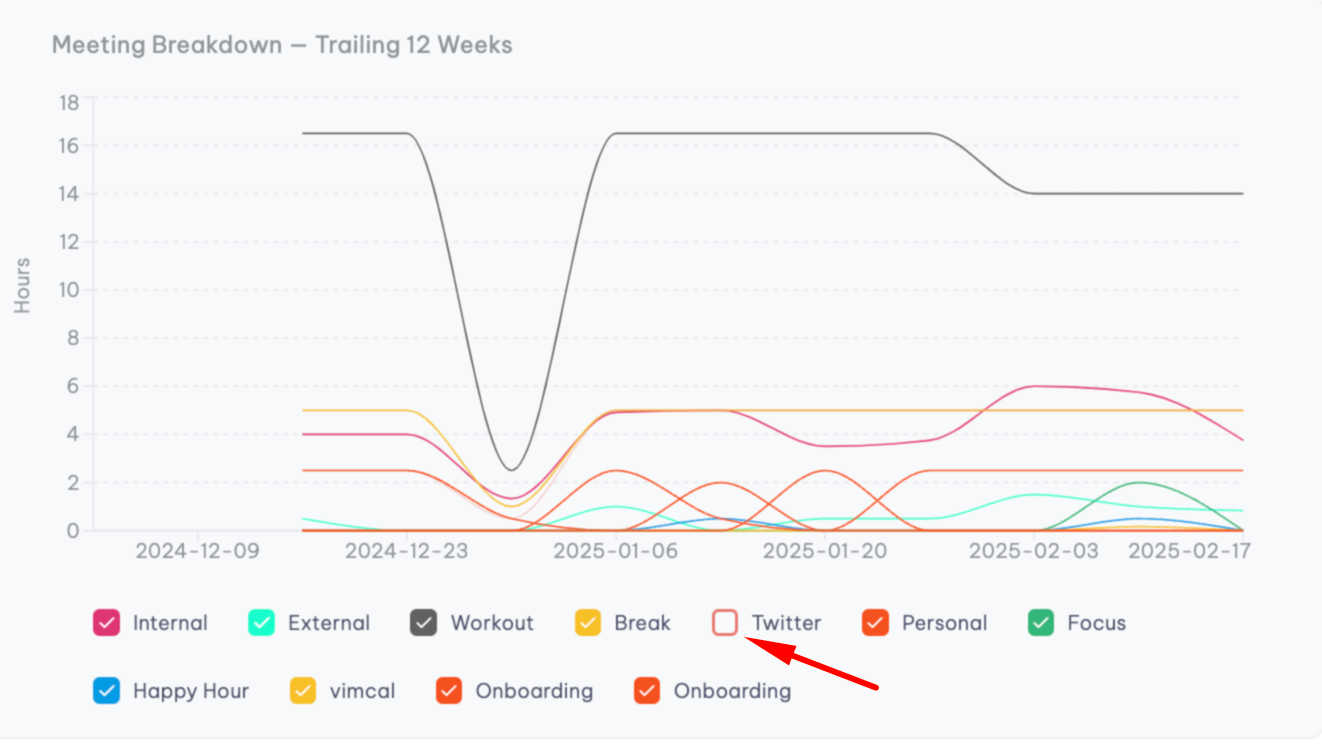
Interactive meeting graph
Customize your view with an interactive graph that adapts to your preferences. Simply check or uncheck tags to filter your meeting data instantly and watch the graph transform in real-time. This graph breaks down time spent based on meetings you tagged using Vimcal's Tag feature.
Internal vs. external time allocation
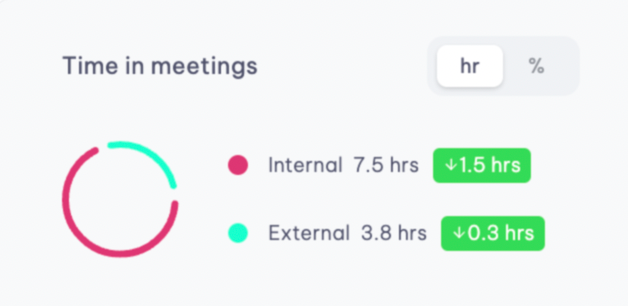
The pie chart offers a visual breakdown of how you're dividing your meeting time:
- Internal meetings with team members
- External meetings with clients or partners
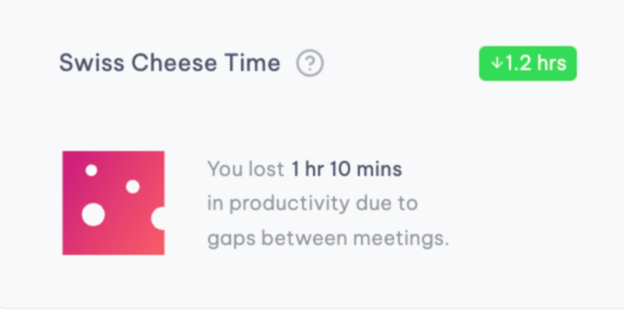
Swiss Cheese Time
The Swiss Cheese Time section reveals productivity leaks caused by gaps of 30 minutes or less between meetings.
People you met with over the last week
A comprehensive list of your connections from the past week. This section provides a quick overview of your interactions, showing:
- Who you've connected with
- Number of meetings per person
- Breakdown of internal and external contacts